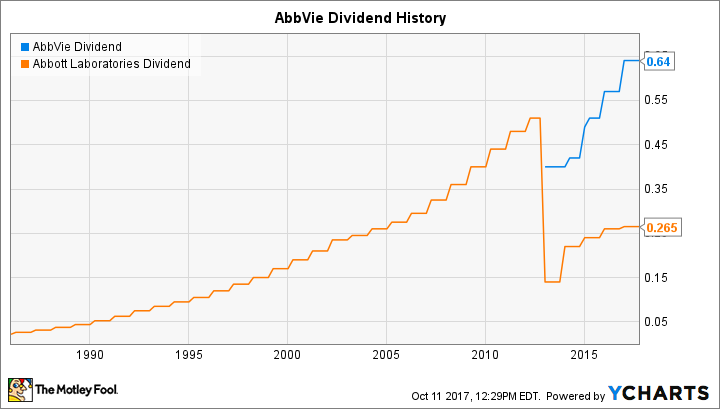
The abbv dividend history shows one of the more consistent dividend-growth records among large U.S. pharmaceutical companies. AbbVie Inc. began trading independently in January 2013 after separating from Abbott Laboratories, and it has maintained a quarterly cash dividend ever since.
As of September 10, 2026, AbbVie has paid three $1.73 quarterly dividends during 2026, for $5.19 in dividends recorded so far this year. The latest payment was made on August 14, 2026, after a July 15 record date. AbbVie’s current quarterly rate represents a 5.5% increase from the $1.64 rate used in 2025.
For investors, the key question is how quickly the payment has grown, how reliable the schedule has been, and whether the underlying business can continue supporting future increases.
ABBV Dividend History at a Glance
| Year | Annual dividends per share | Key quarterly rate |
|---|---|---|
| 2026* | $5.19 | $1.73 |
| 2025 | $6.56 | $1.64 |
| 2024 | $6.20 | $1.55 |
| 2023 | $5.92 | $1.48 |
| 2022 | $5.64 | $1.41 |
| 2021 | $5.20 | $1.30 |
| 2020 | $4.72 | $1.18 |
| 2019 | $4.28 | $1.07 |
| 2018 | $3.59 | $0.96 |
| 2017 | $2.56 | $0.64 |
| 2016 | $2.28 | $0.57 |
| 2015 | $2.02 | $0.51 |
| 2014 | $1.66 | $0.42 |
| 2013 | $1.60 | $0.40 |
*2026 reflects dividends recorded through August 14, 2026. Amounts are U.S. dollars per share.
The table shows the long-term trend clearly: annual dividends increased from $1.60 in 2013 to $6.56 in 2025, while the quarterly rate rose from $0.40 to $1.64. The 2026 rate is now $1.73 per quarter.
ABBV Dividend History by Year
AbbVie’s official records show a regular quarterly pattern. In most years, shareholders received four payments at a stable rate, followed by a higher rate after the next increase.
In 2013, ABBV paid $0.40 per share in each quarter, producing $1.60 for the year. The inaugural dividend was declared in January 2013 and payable February 15, 2013. AbbVie was created through its separation from Abbott, so the early record needs context when comparing it with companies that have operated independently for decades.
The quarterly rate moved to $0.42 in 2014, then to $0.49 for the first 2015 payment and $0.51 for the remaining 2015 payments. In 2016, the quarterly dividend became $0.57, followed by $0.64 throughout 2017.
A particularly notable step came in early 2018. AbbVie raised the dividend from $0.71 to $0.96, a 35% increase. Its investor-relations release said the increase brought cumulative growth from inception to 140% at that time.
From there, the progression became more measured: $1.07 in 2019, $1.18 in 2020, $1.30 in 2021, $1.41 in 2022, and $1.48 in 2023. The pattern continued with $1.55 in 2024 and $1.64 in 2025.
In October 2025, AbbVie announced another increase, lifting the rate to $1.73 for the dividend payable in February 2026. The company described that move as approximately 5.5% growth and said the quarterly dividend had increased by more than 330% since its 2013 inception.
The Latest ABBV Dividend History
AbbVie’s official record shows three payments recorded in 2026 so far:
| Record date | Declaration date | Payment date | Dividend |
|---|---|---|---|
| January 16, 2026 | October 31, 2025 | February 17, 2026 | $1.73 |
| April 15, 2026 | February 19, 2026 | May 15, 2026 | $1.73 |
| July 15, 2026 | June 18, 2026 | August 14, 2026 | $1.73 |
At the $1.73 quarterly rate, the current annualized run rate is $6.92 per share, but annualizing a quarterly payment does not guarantee four future payments at that rate.
The distinction matters because AbbVie’s board controls future declarations. Its 2026 filing says future dividends depend on financial condition, earnings, capital requirements, debt covenants, legal and regulatory requirements, and other factors.
How Fast Has the Dividend Grown?
Looking at the abbv dividend history, the strongest feature is cumulative growth rather than any single year’s increase.
The quarterly payment rose from $0.40 in 2013 to $1.73 in 2026. That is an increase of more than 330%, consistent with AbbVie’s own description when it announced the 2026 increase.
Annual totals show the same trend. Dividends per share increased from $1.60 in 2013 to $6.56 in 2025, more than four times the original annual payout.
Growth has also moderated. The 2018 increase was unusually large, while the increases in 2024, 2025, and 2026 were about 4.9%, 5.8%, and 5.5%, respectively. That points to a mature dividend-growth profile: still expanding, but at a more measured pace than in earlier years.
ABBV Dividend History and Payment Schedule
AbbVie normally pays dividends four times a year. Recent record dates have generally fallen around January, April, July, and October, with payments following several weeks later.
The 2026 schedule illustrates the mechanics. A January 16 record date corresponded to a February 17 payment, an April 15 record date to a May 15 payment, and a July 15 record date to an August 14 payment. Dates can shift, so investors should verify the latest declaration before trading.
It is also important to separate declaration date, record date, ex-dividend date, and payment date. The declaration date is when the board announces the dividend. The record date identifies shareholders entitled to receive it, while the ex-dividend date determines when new buyers no longer qualify under standard rules. The payment date is when the cash is distributed.
What the ABBV Dividend History Says About Income Investing
A long record of increases is useful evidence, but it is not a promise about the future. Dividend investors should combine the historical series with earnings, cash flow, debt, business concentration, and capital-allocation priorities.
AbbVie also shows why payout ratios can be tricky in pharmaceutical analysis. Accounting earnings may be affected by amortization, acquisitions, impairments, and other items. In first-quarter 2026 results, for example, AbbVie reported GAAP diluted EPS of $0.39 and adjusted diluted EPS of $2.65, with the difference including acquisition-related research and development expenses and milestones.
The company’s business mix matters too. AbbVie has been shifting growth toward newer products as older products mature. First-quarter 2026 results showed strong reported revenue growth, including gains in immunology and neuroscience, while Humira revenue continued to decline. Those trends matter because long-term dividend capacity ultimately depends on the cash economics of the business, not the historical record alone.
When comparing the abbv dividend history with peers, focus on growth consistency, cash coverage, and durability of the underlying drug portfolio over time.
Is ABBV a Dividend Aristocrat?
AbbVie is often described in dividend discussions as a Dividend Aristocrat, but the history needs careful wording. AbbVie inherited a long dividend-growth lineage associated with Abbott after its 2013 separation, and AbbVie has continued raising its own dividend since becoming independent.
AbbVie’s 2018 investor release said it was a member of the S&P Dividend Aristocrats Index and noted that the index accounted for spin-off companies in its treatment. Its 2013 release likewise explained that the company was included because of a change in the index’s treatment of spin-offs.
This distinction is important for readers studying the abbv dividend history. The company’s independent trading history begins in 2013, while its qualifying dividend-growth heritage is tied to the longer Abbott record.
Common Mistakes When Researching ABBV Dividends
One mistake is using the latest annual dividend from a finance website without checking the underlying company record. Aggregators can show annualized figures that include a newly increased quarterly rate before four payments at that rate have occurred.
Another mistake is comparing dividend yield without considering share price. Yield moves with the stock price, so a higher yield does not automatically mean the dividend itself has improved.
Investors should also avoid treating past increases as guaranteed. AbbVie explicitly says future dividend decisions remain at the board’s discretion and depend on financial and operating conditions.
What Could Investors Watch Next?
The next major checkpoint is the company’s future dividend declaration, particularly whether the current $1.73 quarterly rate is maintained and whether another increase is announced later in 2026.
Investors should watch adjusted earnings growth, operating cash flow, debt levels, pipeline progress, performance of newer products, and the pace of decline in legacy products. These indicators provide more context than the dividend declaration alone.
ABBV Dividend History: Key Takeaways
The abbv dividend history is defined by continuity, rising quarterly payments, and a clear long-term upward trend. AbbVie began with a $0.40 quarterly dividend in 2013 and now pays $1.73 per share per quarter.
Through August 2026, shareholders have received $5.19 per share in dividends for the year, while the current quarterly rate annualizes to $6.92. The latest increase was approximately 5.5%, following increases of about 5.8% in 2025 and 4.9% in 2024.
For investors researching the abbv dividend history, the key takeaway is that AbbVie has built a substantial record of dividend growth since its independence. The next step is to evaluate whether future earnings and cash flow can support that record, rather than assuming the past automatically predicts the future.