Risk management requires more than just guessing which threats might harm your business. You need hard data to justify security budgets and prioritize defensive strategies. This is exactly where annualized loss expectancy becomes your most valuable metric. By assigning a concrete dollar value to potential risks, you transform vague cybersecurity fears into actionable financial data.
Security professionals rely on this calculation to determine exactly how much money a specific threat will cost an organization over a single year. Without this metric, you risk overspending on minor threats while leaving critical assets dangerously exposed. This comprehensive guide covers the exact formula, real-world examples, and expert strategies for calculating your annualized loss expectancy with absolute precision.
Quick Facts: Quantitative Risk Metrics
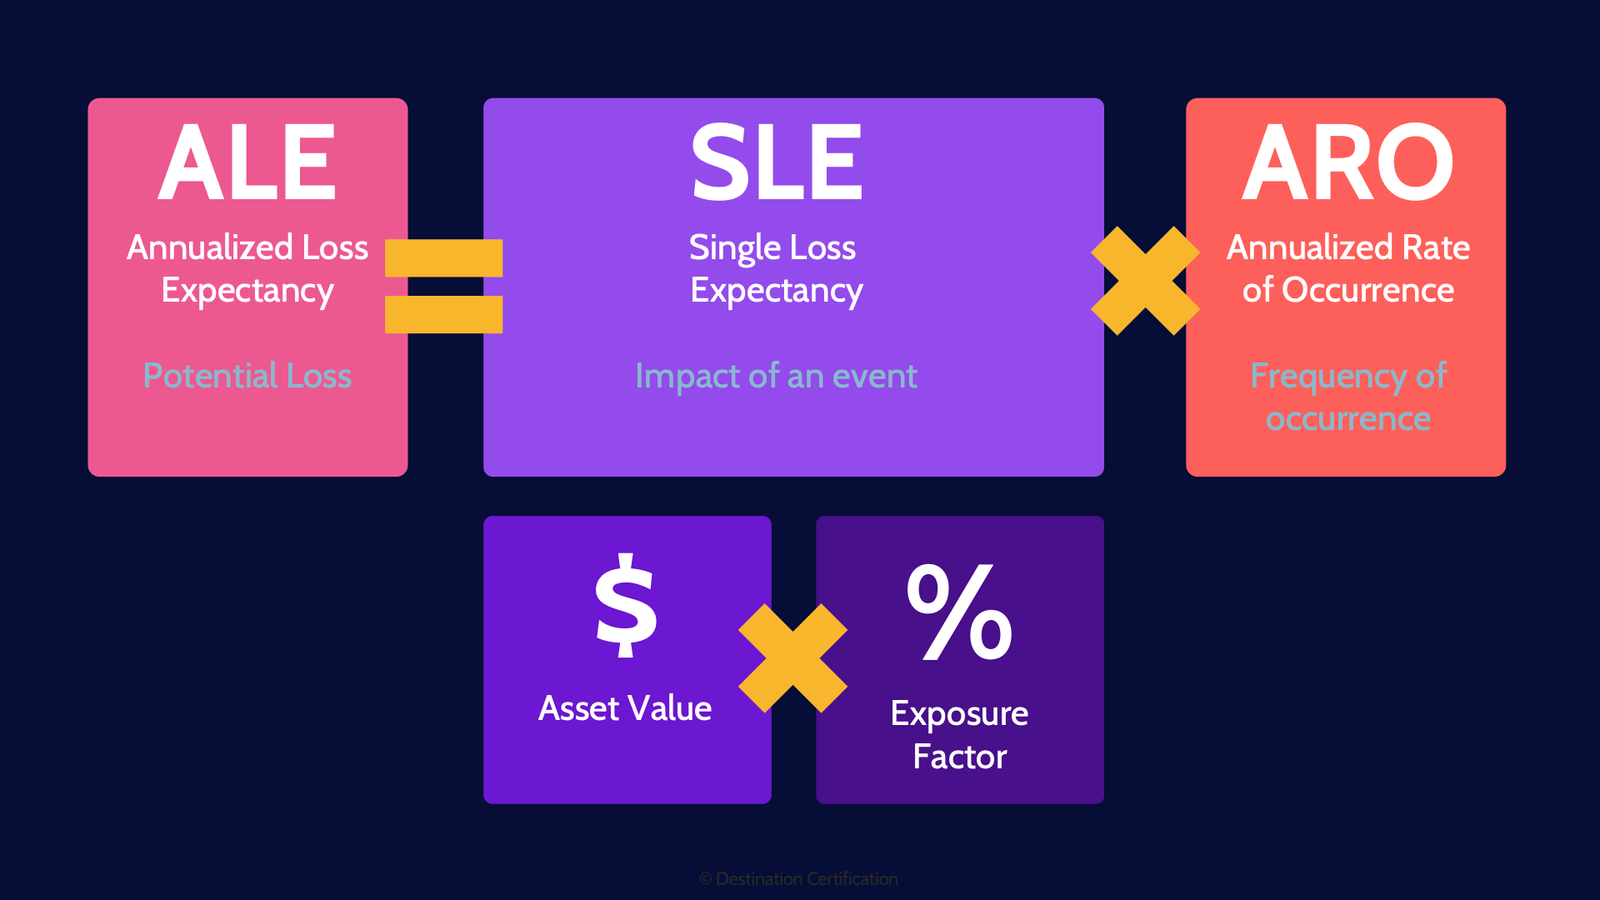
- Asset Value (AV): The total financial worth of a specific business asset.
- Exposure Factor (EF): The percentage of loss a threat causes to an asset.
- Single Loss Expectancy (SLE): The financial loss from a single incident (AV × EF).
- Annualized Rate of Occurrence (ARO): How often the threat happens in one year.
- Annualized Loss Expectancy (ALE): The yearly projected financial loss (SLE × ARO).
What is Annualized Loss Expectancy?
At its core, It is a quantitative risk assessment tool used by IT and security professionals. It projects the anticipated financial loss an organization will experience from a specific risk over exactly 365 days. Think of it as a financial forecast for worst-case scenarios.
Using this metric shifts risk discussions away from technical jargon and into the universal language of business: money. When you present executives with an annualized loss expectancy report, they instantly understand the financial stakes. This metric bridges the gap between IT operations and corporate finance. It enables leadership to make informed decisions about purchasing insurance, upgrading infrastructure, or accepting a specific level of risk.
The Annualized Loss Expectancy Formula Explained
To master your annualized loss expectancy, you first need to understand the underlying equation. The formula relies on two primary variables multiplied together.
Formula: SLE × ARO = ALE
You must break down both the Single Loss Expectancy (SLE) and the Annualized Rate of Occurrence (ARO) to get an accurate result. Let us explore exactly how to calculate these foundational metrics.
Single Loss Expectancy (SLE)
The SLE represents the exact amount of money your organization loses when a specific threat occurs just one time. You calculate this by multiplying the Asset Value (AV) by the Exposure Factor (EF). For example, if a server is worth $100,000 and a fire would destroy 50% of it, your SLE is $50,000.
Determining Asset Value requires looking beyond just the hardware costs. You must factor in software licenses, proprietary data value, and the cost of operational downtime. The Exposure Factor is equally critical, requiring you to estimate the exact percentage of damage a specific threat vector will cause.
Annualized Rate of Occurrence (ARO)
The ARO dictates how many times you expect a specific threat to materialize within a single calendar year. This number can range from a fraction (for rare events) to a high integer (for frequent attacks). For instance, an ARO of 0.1 means the event happens once every ten years.
To determine an accurate ARO, you must rely on historical data, industry threat reports, and internal security logs. Guessing your ARO will completely ruin the accuracy of your annualized loss expectancy calculation. Always use empirical data from credible sources like Verizon’s Data Breach Investigations Report (DBIR) or your own SIEM software.
Step-by-Step: Calculating Annualized Loss Expectancy
Applying the formula to real-world scenarios is the best way to understand its power. Let us walk through two common enterprise scenarios to calculate the exact annualized loss expectancy.
Scenario 1: E-Commerce Server Crash
Imagine you run an e-commerce platform that generates $50,000 in revenue per hour. Your main database server hardware costs $20,000.
- Asset Value (AV): Hardware ($20,000) + 4 hours of downtime revenue loss ($200,000) = $220,000.
- Exposure Factor (EF): A crash completely halts sales but leaves the hardware intact. We will assign an EF of 90% (0.9) to account for data restoration labor.
- Single Loss Expectancy (SLE): $220,000 × 0.9 = $198,000.
- Annualized Rate of Occurrence (ARO): Historical data shows this server crashes twice a year (2.0).
Calculation: $198,000 (SLE) × 2 (ARO) = $396,000. Your annualized loss expectancy for this server crash is $396,000.
Scenario 2: Regional Flood Damage
Consider a physical data center located in a known flood zone. The entire facility and its contents are valued at $5,000,000.
- Asset Value (AV): $5,000,000.
- Exposure Factor (EF): A severe flood would destroy 40% of the equipment (0.4).
- Single Loss Expectancy (SLE): $5,000,000 × 0.4 = $2,000,000.
- Annualized Rate of Occurrence (ARO): Local weather data indicates a severe flood happens once every 20 years (1/20 = 0.05).
Calculation: $2,000,000 (SLE) × 0.05 (ARO) = $100,000. Your annualized loss expectancy for flood damage is $100,000.
Why Annualized Loss Expectancy Matters for Cost-Benefit Analysis
Knowing your annualized loss is only half the battle. The true value lies in using this metric to perform a Cost-Benefit Analysis (CBA) for new security controls. You should never spend more to protect an asset than the asset’s projected loss.
To determine the value of a security safeguard, use this extended formula:
(ALE before safeguard) – (ALE after safeguard) – (Annual cost of safeguard) = Value of Safeguard.
If the final number is positive, the security investment makes perfect financial sense. If the number is negative, you are overspending on security and should consider alternative risk management strategies like risk transfer (insurance).
Qualitative vs. Quantitative Risk Analysis
Risk assessments generally fall into two categories. Understanding the difference highlights exactly why determining your annualized loss is so vital for mature organizations.
| Feature | Quantitative Risk Analysis (ALE) | Qualitative Risk Analysis |
| Output Type | Concrete dollar amounts ($) | Subjective labels (High, Medium, Low) |
| Data Required | Historical logs, asset valuations | Expert intuition, surveys, best guesses |
| Time to Complete | High (Requires intense research) | Low (Can be done quickly in meetings) |
| Executive Buy-in | Very High (Business language) | Moderate (Often seen as subjective) |
| Best Used For | Budgeting, ROI calculations | Initial threat screening, triage |
While qualitative analysis is great for quickly identifying threats, quantitative analysis gives you the financial leverage needed to execute a security strategy. Relying solely on qualitative data often results in underfunded security programs.
Common Mistakes When Using Annualized Loss Expectancy
Even seasoned CISOs make calculation errors when deploying quantitative risk metrics. Avoid these common pitfalls to ensure your annualized loss expectancy remains accurate and defensible.
1. Ignoring Intangible Assets
Many IT managers calculate Asset Value based purely on hardware and software receipts. They completely ignore the catastrophic costs of reputational damage, customer churn, and regulatory fines. Always include intangible assets and legal liabilities when calculating your single loss expectancy.
2. Relying on Outdated Threat Intelligence
Using a ten-year-old threat report to determine your Annualized Rate of Occurrence will yield dangerous results. Ransomware attacks happen much more frequently today than they did a decade ago. Continuously update your ARO variables using the latest cybersecurity intelligence available.
3. Confusing Exposure Factor with Probability
Exposure factor measures how much damage is done during an event, not how likely the event is to happen. Mixing these two concepts up will completely invalidate your annualized loss expectancy. Keep probability isolated exclusively to your ARO metric.
Improving Your Annualized Loss Expectancy Accuracy
Precision is the key to successful risk management. To improve the accuracy of your annualized loss expectancy, start by maintaining a meticulous IT asset inventory. You cannot protect or value an asset you do not know exists. Implement automated discovery tools to keep your asset values continuously updated.
Next, actively collaborate with your legal and human resources departments. They possess critical insights regarding compliance fines and employee productivity costs that deeply impact your SLE. Finally, run multiple annualized loss expectancy scenarios using optimistic, pessimistic, and most-likely variables to create a realistic spectrum of potential risk.
Integrating Annualized Loss Expectancy into Cybersecurity Frameworks
Major cybersecurity frameworks heavily encourage the use of quantitative metrics. NIST SP 800-30 explicitly details the necessity of calculating threat likelihood and impact. Incorporating annualized loss expectancy into your NIST compliance strategy provides hard evidence to auditors that you are taking a data-driven approach to risk mitigation.
Similarly, ISO 27001 requires organizations to establish a robust risk assessment methodology. Presenting an annualized loss expectancy matrix during an ISO audit demonstrates maturity and precise control over your Information Security Management System (ISMS). It proves your security budget is tied directly to mathematical risk realities rather than arbitrary spending limits.
Advanced Annualized Loss Expectancy Scenarios
For massive enterprise environments, basic calculations often evolve into complex Monte Carlo simulations. These advanced statistical models run thousands of annualized loss expectancy calculations simultaneously. They account for fluctuating variables, resulting in a highly accurate probability distribution of potential financial losses.
Furthermore, cloud computing introduces shared responsibility models that impact your calculations. If AWS or Azure handles your physical security, your exposure factor for hardware theft drops to zero. However, your exposure factor for misconfigured access controls might increase. You must adjust your annualized loss expectancy variables dynamically as you migrate workloads to the cloud.
Mastering Risk to Protect the Bottom Line
Cybersecurity is no longer just a technical discipline; it is a fundamental pillar of corporate finance. Calculating your annualized loss expectancy empowers you to speak the language of the boardroom with absolute confidence. It transforms vague threats like “hackers” and “malware” into precise financial liabilities that demand attention.
By mastering Asset Value, Exposure Factor, and Annual Rate of Occurrence, you can pinpoint exactly where your security budget belongs. Stop guessing which threats pose the biggest danger to your organization. Start relying on your annualized loss expectancy to drive intelligent, data-backed security investments that definitively protect your bottom line.